


Download software tagged by pie charts
|
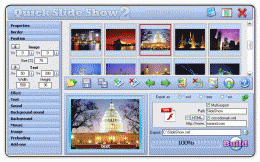
The most popular program: Quick Slide Show 2.00
more info |
|
We recommend: MB Vedic Astrology Divisional Charts 1.65

more info |
csXGraph 1.6 by Chestysoft
2010-03-16
ActiveX control to draw 2D pie charts, bar charts and line graphs. Display the graphs, export to file (GIF, PNG, BMP) or data stream or copy to the clipboard. Properties allow full control over colours and fonts. Free trial.
Spreadsheet Converter to HTML JavaScript 3.4.2 by Framtidsforum I-amp-M AB
2006-10-25
Convert MS Excel spreadsheet into good-looking calculating web page. No plugins. No programming needed. Supports 180 Excel-functions. Use it for expense report, survey, order form, application, financial advisor, ROI. Live line, bar, pie charts!
Sensor Charts 1.0.3 by DevNetPlanet
2018-11-01
Sensor Charts is a powerful tool able to record automatically in background all sensors data and render it at your command in wonderful and colorful charts.
Easy Chart 3D GEO 1.1 by GeoBrush International
2005-10-25
Easy Chart 3D GEO is easy to use graphical reporting tool for effortless generation of business, management, financial and ad-hoc pie charts (Cylinders and Cubes also supported) of professional quality. Oracle, Microsoft SQL, Access and ODBC support
2009-02-21
Copy multiple charts from Excel into a new or existing MS PowerPoint file. Excel 2000 or higher required. MS PowerPoint 2000 or higher required.
2009-03-30
Copy multiple charts from MS Excel into a new or existing MS Word document. Excel 2000 or higher required. Word 2000 or higher required.
AnyStock Stock and Financial JS Charts 8.6.0 by AnyChart JavaScript Charts
2019-05-22
AnyStock Stock and Financial JS Charts is a flexible JavaScript charting library to visualizing large data sets in interactive HTML5 charts. Designed to display date/time information it offers various chart types, drawing tools, technical indicators.
MB Free Vedic Astrology Divisional Charts 1.0 by MysticBoard.com
2007-08-08
MB Vedic Astrology Divisional Charts is an advanced yet simple software based on the principles of Indian Astrology. It gives an insight into the Rashi Chart of a person along with his/her Divisional Charts.