


Download software tagged by data analytics and visualization
|
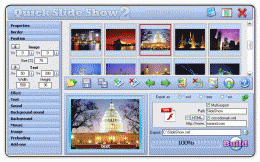
The most popular program: Quick Slide Show 2.00
more info |
|
We recommend: Logaholic Web Analytics & Web Stats 2.4.3
more info |
Web Analytics Software 2.0 by sqaki.com/1/WebAnalytics/
2008-06-10
Web Analytics Software Strategy Development Framework Model, Strategic Management
Surfstats Log Analyzer 2012.6.1 by SurfStats Software cc.
2013-06-04
SurfStats Website Analytics generates Website Analytics and Conversion Tracking reports from log files. Reports can be generated in various languages with output to screen, file directory, ftp or email. It supports most common log file formats.
FREE WEB ANALYTICS SERVICE 1.0 by basicanalytics.com
2006-12-19
Free web analytics service delivered by daily email from basicanalytics.com is an easy and convenient way for busy people to keep track of your site.
Michigan Marketing and Analytics Essay 1.0 by Netvantage Marketing
2008-07-23
Netvantage Marketing essay on how to improve online marketing campaigns through analytics.
Michigan SEO PPC web analytics article 1.0 by Netvantage Marketing
2008-07-25
Article on the benefits of web analytics in learning more about your pay per click, search engine optimization, and internet marketing strategy
AnyStock Stock and Financial JS Charts 7.8.0 by AnyChart JavaScript Charts
2016-01-08
AnyStock Stock and Financial JS Charts is a flexible JavaScript charting library to create interactive real-time data charts. Designed to visualize date/time information in HTML5, it offers various chart types, drawing tools and technical indicators.
AnyStock Stock and Financial JS Charts 8.6.0 by AnyChart JavaScript Charts
2019-05-22
AnyStock Stock and Financial JS Charts is a flexible JavaScript charting library to visualizing large data sets in interactive HTML5 charts. Designed to display date/time information it offers various chart types, drawing tools, technical indicators.
LeoDataAnalysis 1.1 by LeoKrut
2018-02-12
Statistical analysis, fitting and visualization of multi-parameter data sets. Statistical schemes cover creating conditional histograms, curve fitting with least square method and user defined formula, multivariate state of art fitting.